from math importPiimport arraymancer, datamancer, ggplotnim
let
t = linspace(0.0, 39.0*Pi*0.5, 1000)
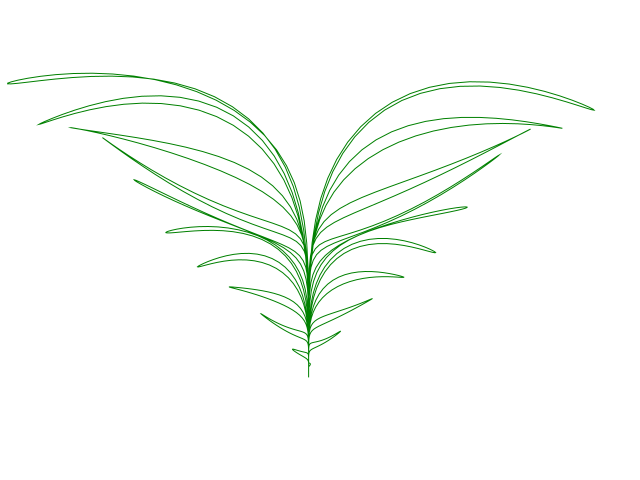
x = t *. cos(t)^.3
y = 9.0 * t *. sqrt(abs(cos(t))) + t *. sin(0.2*t) *. cos(4.0*t)
df = toDf(t, x, y)
ggplot(df, aes("x", "y")) + geom_line(color="green") + theme_void() + ggsave("trigonometric_plant.png")
The above is a nim port of this python version:
t = linspace(0, 39*pi/2, 1000) x = t*cos(t)**3 y = 9*t*sqrt(abs(cos(t))) + t*sin(0.2*t)*cos(4*t) plt.plot(x, y, c="green") pic.twitter.com/8Dd0UfEArv
import nimib, strformat
nbInit
nbText: """# A plane curve that looks like a plant
"""
nbCode:
from math importPiimport arraymancer, datamancer, ggplotnim
let
t = linspace(0.0, 39.0*Pi*0.5, 1000)
x = t *. cos(t)^.3
y = 9.0 * t *. sqrt(abs(cos(t))) + t *. sin(0.2*t) *. cos(4.0*t)
df = toDf(t, x, y)
ggplot(df, aes("x", "y")) + geom_line(color="green") + theme_void() + ggsave("trigonometric_plant.png")
nbClearOutput # to remove output from ggplotnim when saving the png
nbImage("trigonometric_plant.png")
nbText: "The above is a nim port of this python version:"
nbRawOutput: """<blockquote class="twitter-tweet"><p lang="en" dir="ltr">t = linspace(0, 39*pi/2, 1000)<br>x = t*cos(t)**3<br>y = 9*t*sqrt(abs(cos(t))) + t*sin(0.2*t)*cos(4*t)<br>plt.plot(x, y, c="green") <a href="https://t.co/8Dd0UfEArv">pic.twitter.com/8Dd0UfEArv</a></p>— Scientific Python (@SciPyTip) <a href="https://twitter.com/SciPyTip/status/1554290482263592960?ref_src=twsrc%5Etfw">August 2, 2022</a></blockquote> <script async src="https://platform.twitter.com/widgets.js" charset="utf-8"></script>"""
nbText: """Note that:
- `math` is needed for `Pi` (`cos`, `sin`, `sqrt`, `abs` are tensor operations that come from arraymancer)
- `linspace` is from `arraymancer` and `t`, `x` and `y` are all Tensors (there is also a `linspace` in `numericalnim` which outputs `seq`s)
- I probably do not need to explicitly import `datamancer` to use `toDf` (I think it is included in ggplotnim)
- I have to carefully convert all integers into floats (I could have imported lenientops)
- I am using the dotted version of operators (`*.`, `^.`) that apply the operator to the tensor elementwise
- `color` goes in `geom_line` and not in `aes` call (oddly enough if I put `color="green"` in `aes` it will plot with a reddish color)
- I am using `theme_void` to remove axis and grey grid (not sure how to remove just the grey grid without removing axis)
- see below in source code comments addressing issues when running on windows
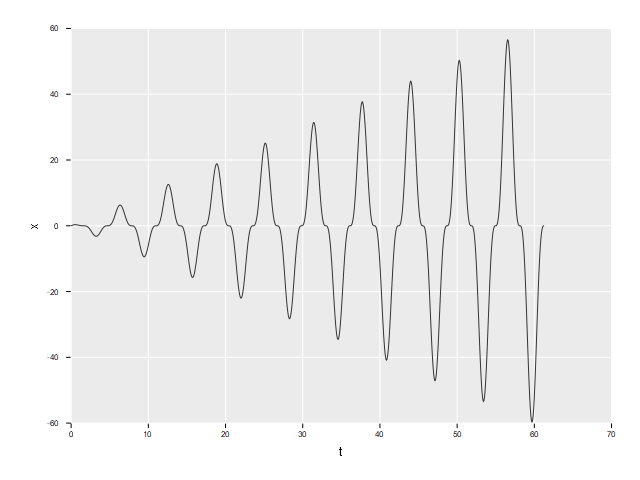
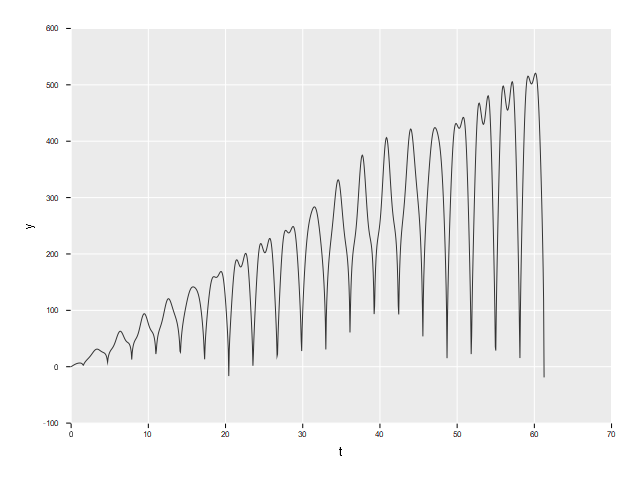
It is nice also to see how `x` and `y` look like:
"""
nbCode:
ggplot(df, aes("t", "x")) + xlab("t") + ylab("x") + geom_line() + ggsave("trigonometric_plant_x.png")
nbClearOutput
nbImage("trigonometric_plant_x.png")
nbCode:
ggplot(df, aes("t", "y")) + xlab("t") + ylab("y") + geom_line() + ggsave("trigonometric_plant_y.png")
nbClearOutput
nbImage("trigonometric_plant_y.png")
nbSave
# for windows:# - use -d:nolapack, see https://github.com/Vindaar/ggplotnim/issues/133# - download the cairo-windows zip from https://github.com/preshing/cairo-windows/releases/# - unzip, move cairo.dll in same folder from where I am running the file, rename to libcairo-2.dll# - the final command I ran from nblog root folder (where I put the renamed dll) is:# `nim r -d:nolapack .\drafts\trigonometric_plant.nim --nbShow`